Published:
Talks and presentations
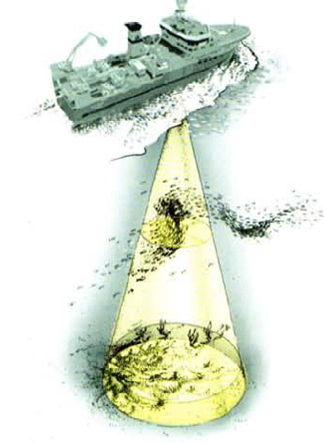
Recording acoustic data in the twilight and midnight zones at close range.
Published in 11TH INTERNATIONAL WORKSHOP ON MARINE TECHNOLOGY, 2024
Recording acoustic data in the twilight and midnight zones at close range
Unraveling Variations in Deep Scattering Layers: Insights from the Iberian Peninsula waters and Beyond.
Published in Working Group on Fisheries Acoustics, Science and Technology (WGFAST), 2024, 2024
Unraveling Variations in Deep Scattering Layers: Insights from the Iberian Peninsula waters and Beyond
Recording acoustic data from the surface to 4500 m depth with an AZFP attached to the rosette.
Published in Working Group on Fisheries Acoustics, Science and Technology (WGFAST), 2023, 2023
Recording acoustic data from the surface to 4500 m depth with an AZFP attached to the rosette.
Peña, M. Using histogram equalization to visualize acoustic and ancillary data.
Published in Working Group on Fisheries Acoustics, Science and Technology (WGFAST)., 2022
Echogram visualization and processing is one of the most time-consuming tasks for fisheries acousticians. Analyzing target species or features is often based on experience while visualization settings are inherited from colleagues or established for standardization purposes within international efforts. Acoustic data is often visualized with a standard minimum threshold for Sv that varies with target species. For instance, small pelagic fishes are often visualized in European waters from − 60 dB re 1 m2 m− 3 while echograms of the mesopelagic zone (200–1000 m depth) usually employ a − 90 or − 80 dB re 1 m2 m− 3 minimum threshold. However, numerical volume density changes greatly with depth (particularly beyond the shelf), time of the day and season, and thus setting an incorrect threshold may mask part of the population at some times or areas. Following on Blackwell et al. (2019) that showed the best colormaps to be employed in fisheries acoustics, this presentation focus on further parameters (general thresholds and location of the color limits) of the colorbar. Most colormaps employ linear relationship between data and color, where every color represents a similar range of values. This can hide interesting features in only one or two colors. Histogram equalization is a non-linear interpolation technique that locates thresholds and color limits at the quantiles of the image data. Examples using acoustic and ancillary data will be shown to highlight the benefits of this technique. While no definite conclusion is provided, some food for thought on the influence of the number of colors employed will also be provided. Keywords Echogram visualisation, colormaps, histogram equalizarion
Fernández Castro, B.; Peña, M.; Nogueira, E.; Gilcoto, M.; Broullón, E.; Comesaña, A.; Bouffard, D.; Naveira Garabato, Alberto C.. & Mouriño-Carballido, B. Efficient biological ocean mixing in fish spawning aggregations
Published in Mescolamento, transporto, e dinamiche termiche in fiumi, laghi e mare: dialogo tra fisica e biologia. XXV Congreso AIOL., 2021
Sarmiento-Lezcano, A.; Olivar, P.; Peña, M.; Landeira, J.; Armengol, L.; Medina-Suárez, I.; Manfrida, D.; Castellón, A. & Hernández-León, S. Carbon remineralization by small mesopelagic and bathypelagic Stomiforms in the Northeast Atlantic Ocean.
Published in ASLO 2021. Unravelling the ecology and biogeochemistry of the msopelagic zone. , 2021
Póster: Olivar el al. Changes in vertical location in the water column of meso- and bathypelagic species through development: behaviour vs hydrography
Published in Larval fish conference, 2019
Póster: Sarmiento et al. Composition and distribution of mesopelagic fish larvae off the west coast of the baja california peninsula during climate anomalies in summer 2014.
Published in Larval fish conference , 2019
Identifying mesopelagic layers combining acoustic data and light avoidance.
Published in Marine Institute, 2019
